Introduction
Last year, Smart Columbus Open Data Enthusiats (SCODE) was issued an Open Design Challenge. The challenge was to help people find and access Community Services using data from the Smart Columbus Operating System (SCOS). SCODE members could build an interactive map, displaying locations of active service providers where users could navigate the map by location, service provider, and service offerings.
Below are the links to the initial visualization submissions:
What follows are a collection of lessons learned from the SCODE teams and their members.
Data Analysis Team
Entity Relationship Diagram
The initial analysis started with looking at the files listed on the Open Design Challenge and understanding how they related to one another. The 4 comma-separated values (CSV) files are part of the Food Pantry and User Data dataset on the SCOS. That dataset is provided by HandsOn Central Ohio, and is comprised of 34 CSVs in total. The files used in the analysis all have an ACTIVE_FLAG (Y/N) field, we are only displaying active records in our visualizations.
| Listed | Actual |
|---|---|
| Agency | Agency |
| Agency Location | |
| Agency Service | |
| Service Location | |
| Service Taxonomy | Service Taxonomy |
| Taxonomy | Taxonomy |
The Agency file uses name, ID number and other values to tell you about a specific agency. The Service Location file contains contact information (phone numbers, hours, email address, website, etc…) but did not contain an agency’s physical address. That information was found in the Agency Location file. The Agency Service file describes the services an agency offers.
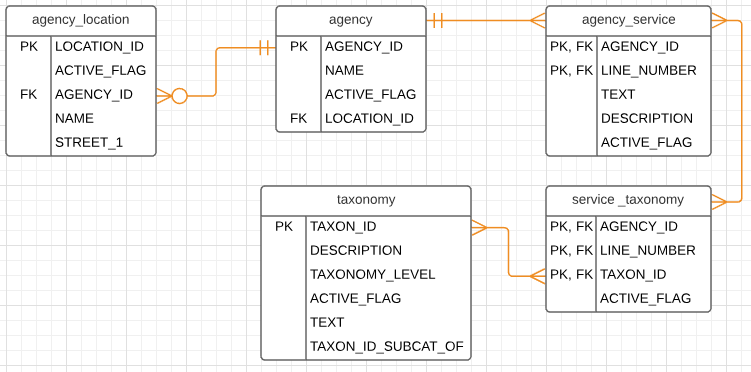
The diagram can be read as follows:
- An agency (can) have “zero, one, or many” location(s).
- An agency (can) provide “one or many” service(s).
- An agency service (can) have “one or many” taxonomies.
Taxonomy Hierarchy?
The taxonomy file has five different physical levels. Each record in the file has a unique TAXON_ID value. That value relates parent and child records from one level to the next. While the records are logically related, the data structure is not a hierarchy. Each record is an individual endpoint. An agency may offer a level 5 service without offering services at levels 1-4.
├── BASIC_NEEDS
│   ├── FOOD
│   │   ├── EMERGENCY_FOOD
│   │   │   ├── FOOD_PANTRIES
├── EDUCATION
│   ├── EDUCATIONAL_PROGRAMS
├── HEALTHCARE
│   ├── SPECIALITY_MEDICINE
│   │   ├── PEDIATRICS
Application Program Interface Team
REST API
The REST API was created using Node JS and Express JS, and the endpoints were separated by resource type (service category/taxonomy, agency information, location information). All of the endpoints either return a single instance (specified by primary/foreign keys) or a list of objects, with specific query parameters and paging available. The service categories can be queried in a hierarchy using the /children endpoint, which returns any categories that are a subcategory of the specified ID.
Any breaking changes to the API were introduced in a new version, with v1 being the raw data from the source and v2 being a prettified and slimmed down version of the data. The API is documented via swagger at /api-docs. All endpoints are tested individually using Chai and Mocha (Javascript testing libraries). Future improvements to the API could include the addition of a GraphQL API to better model the data needed between the entities, and addition of other data sets provided by MOFB.
- Tools: NodeJs, ExpressJS, ChaiJS, MochaJS, Swagger.
- Data set: MOFB Data.
- Source code: Github.
- API Documentation: Swagger.
User Interface Team
PWA using Reactjs, Redux with Google maps
The Community Service locator UI is a progressive web app that creates an interactive map, displaying locations of active service providers where users could navigate the map by location, service provider, and service offerings. It uses Reactjs library and its ecosystem.
- React Ecosystem: Reactjs, Redux, react-google-maps,
- Testing: Jest, Enzyme
- Data set : Rest calls to API project
- Source Code: Github
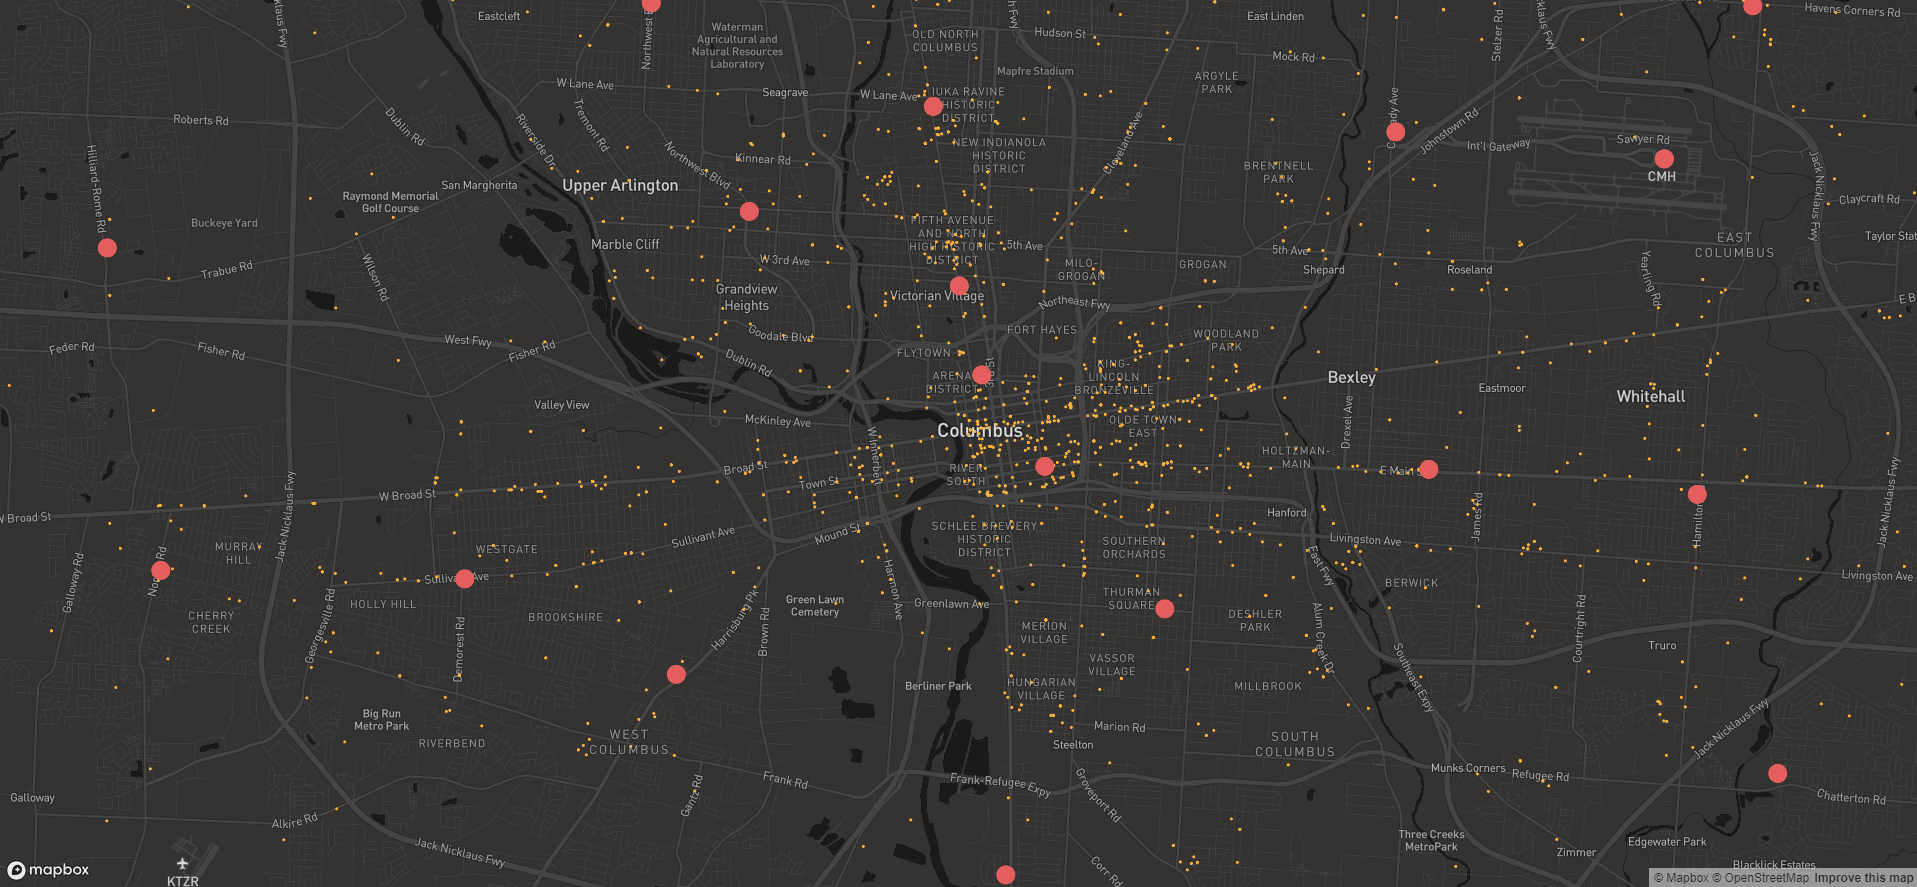
Mapbox
One approach to visualizing these locations on a map is to use React and Mapbox to manage the data as a Vector Tileset. In order for a dataset to be converted to a Vector Tileset, it needs values for Longitude and Latitude, and since the initial dataset did not have these values, they can be run through a Jupyter Notebook in order to produce these values.
From there, Mapbox provides a free tool to upload that data, and convert it into a Vector Tileset. Vector Tilesets are built to work with more front-end mapping frameworks, and reduce work needed to render the data into a map. From this point, a relatively minimal React frontend is used to populate the data on the map. A benefit of this approach is that a query made on the front end can search through the data for these points without the need to talk to the OS since that data is included in the Vector Tileset, although that component of the UI hasn’t been implemented yet.
- Data: Food Bank Agency Locations
- Dataset uploaded through Jupyter Notebook to geocode data, and saved as new csv
- New csv uploaded to Mapbox as tileset (Map ID: mapbox://smrtcbus.9n1znhht)